

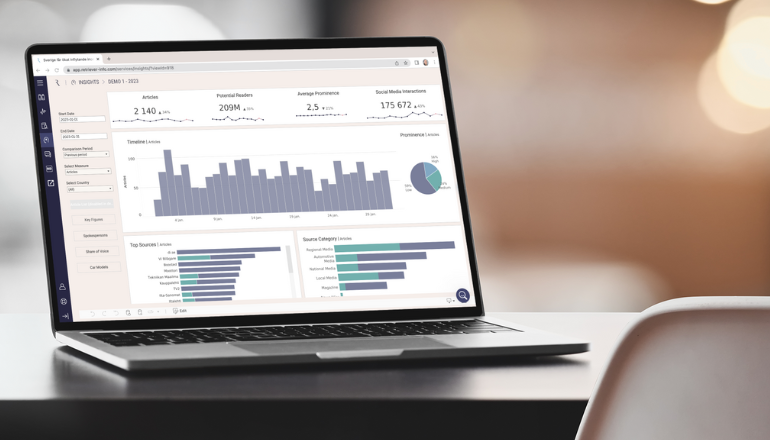
To make it easier for businesses and organisations to work with this data, we have developed the Insights dashboard. Insights is our digital and interactive analytics format that allows you to work with data in a dashboard, helping companies and organisations turn data into actionable insights.
Data visualisation creates understanding
We understand that the data and insights we provide to our clients need to be communicated internally within their organisation. It is therefore important that the company or organisation can easily understand the data and use the insights we provide. Retriever Insights are therefore based on the individual company or organisation and are often tailored to create the right insights. When we work with data visualisation, we also focus on
- creating an overview of large amounts of data
- Provide insight into the stories the company or organisation wants to tell in the media
- putting data into perspective to create greater understanding
- be able to use it as a basis for decision making for our clients
With Insights, companies and organisations can make sense of large amounts of data, understand and make connections between their various initiatives across the company or organisation, highlight the right stories and make the right decisions as a result.
Putting data into perspective is an extremely important element when working with media analysis. Putting media data into perspective can be done by putting the data in context with previous periods so that it is possible to see a trend, benchmarking the media data against other companies' data and/or incorporating KPIs so that the company or organisation can see if it is on the right track. All of this creates a greater understanding of the data when the company or organisation needs to report its figures internally - and all of this is possible with Insights.
The right data and interactivity create insights
Insights can consist of exactly the data your company or organisation needs. Retriever has the ability to integrate and analyse media data - both editorial and social media. This makes it possible to combine different types of data to create more insights. For example, this could be audience data, user behaviour on the company or organisation's website, or sales figures.
Insights consist of various parameters and metrics that are visualised in interactive charts. It's also possible to select specific time periods, access the information behind the graphs and cross-reference graphs to drill down into the information and create the insights the customer needs to do their job.
Insights can be updated daily, weekly or monthly, depending on the need and type of data being visualised. In addition, Insights can be accessed directly from the company's or organisation's Retriever platform, allowing the client to work with their media coverage at any time.
Want to learn more about the possibilities with Insights?